Gold Beaver V5.57
Listing updated
Gold Beaver is a gold Expert Advisor for MetaTrader 5, published by Arnold Bobrinskii. Its linked live signal covers 114 trades in 5 months, at a profit factor of 4.86 and a win rate of 93.86%. A win and a loss are 3.1× apart, so one loss undoes that many wins.
Two records, counted differently. The published record shows 122 trades against the 114 closed trades in the file. The figures on this page are the first of each pair — the published record, which is what the seller's own signal page reports. The second is what the trade history we hold works out to, and it is the file the charts below are drawn from. Neither is wrong: they count different things, and a signal page moves between one reading and the next.
- 114 trades on the linked live signal
- 23 weeks of recorded history
- Tracked on an account opened with 60 USD
- Around 47 copies sold a month
Gold Beaver signal at a glance
The three panels from the MQL5 signal page, with the figures the marketplace itself plots. Its drawdown axis is the relative drawdown by balance — the same measure this site computes from the trade history further down. The equity figure, which counts floating losses on positions still open, is a different number and is printed beside it in the specification.
growth since 2026
417%
Weltrade-Real1:500
Transcribed from MQL5 live signal 2375536, statistics as published on the signal page. See the signal page ↗
- Growth
- +416.7%
- $509 on $60no fixed scale
- Max drawdown
- 14.3%
- $60 · by balance0–100% below the running peak
- Profit factor
- 4.91
- gross win ÷ gross loss1.0 at the centre, 3.0 at the rim
- Win rate
- 94.3%
- 115 of 122 trades0–100% of closed trades
- Payoff ratio
- 0.30
- average win ÷ average loss0 at the centre, 3.0 at the rim
- Recovery factor
- 8.50
- net profit ÷ worst fall0 at the centre, 10× at the rim
Computed from MQL5 live signal 2375536, statistics as published on the signal page. See the source ↗
Gold Beaver Kept Score
Four measured quarters out of 100. Every input is a figure printed elsewhere on this page, read against a band that is the same for every product on the site.
70
out of 100
from published statistics
- Evidence5.9 / 25
122 trades over 6 months
against 0 at the floor, 24 months at full, and 0 at the floor, 500 trades at full
- Risk control21.4 / 25
14.33% worst drawdown
against 0–100% below the running peak
- Consistency25 / 25
4.91 profit factor
against 1.0 at the centre, 3.0 at the rim
- Return on risk21.3 / 25
8.5× recovery factor
against 0 at the centre, 10× at the rim
- Small wins, large losses−4
How the Kept Score is worked out, and every product scored →
Our read on Gold Beaver
What the record above actually shows, and who it suits. Written by us, about these figures — not repeated from the seller.
Gold Beaver pairs a very clean risk shape with a very small account. Both facts are real and they pull in opposite directions.
The clean part is real. Drawdown reached 18.2% on equity against 14.3% on closed trades — the two sitting within four points of each other, which means open losses were being taken rather than parked out of sight. The worst single trade lost $24.47 against an average loss of $18.60: 1.3×, and adjusted for the account’s growth, 0.3×. There is no tail here. The longest losing streak in five months was two trades. Against a profit factor of 4.86 and 8.4× its worst dip recovered in profit, that is a record doing what it claims with no hidden shape in it.
The catch is in how it wins. It takes 93.9% of its trades, and the average loss is 3.1× the average win — so one loss undoes three wins, and the whole edge rests on that hit rate holding. A strategy winning nineteen times in twenty has very little room to get worse before the arithmetic turns.
And the scale is small: the account opened at $60 and $118 was paid in along the way, so the average trade is $4.17. The percentages are honest — growth is time-weighted, so the deposits change the base and never count as performance — but a 37.5% month on sixty dollars is a different proposition from the same month on a funded account.
Gold Beaver screenshots
8 images from the seller's listing, shown as published. Nothing on them has been measured by this site — the figures elsewhere on this page are the check.
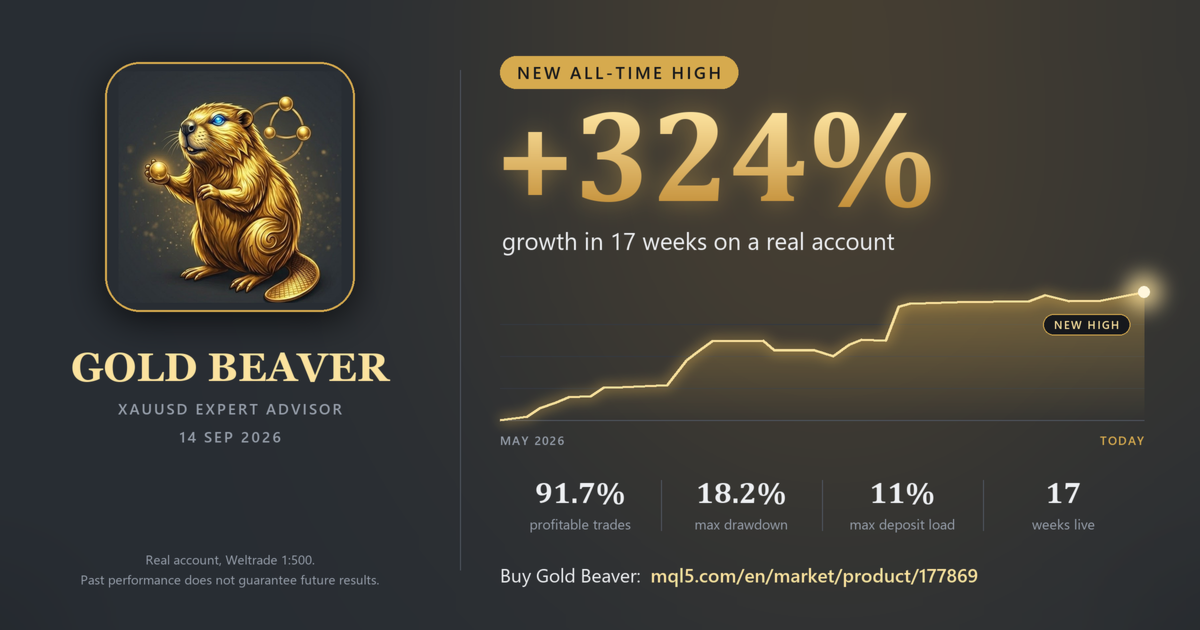
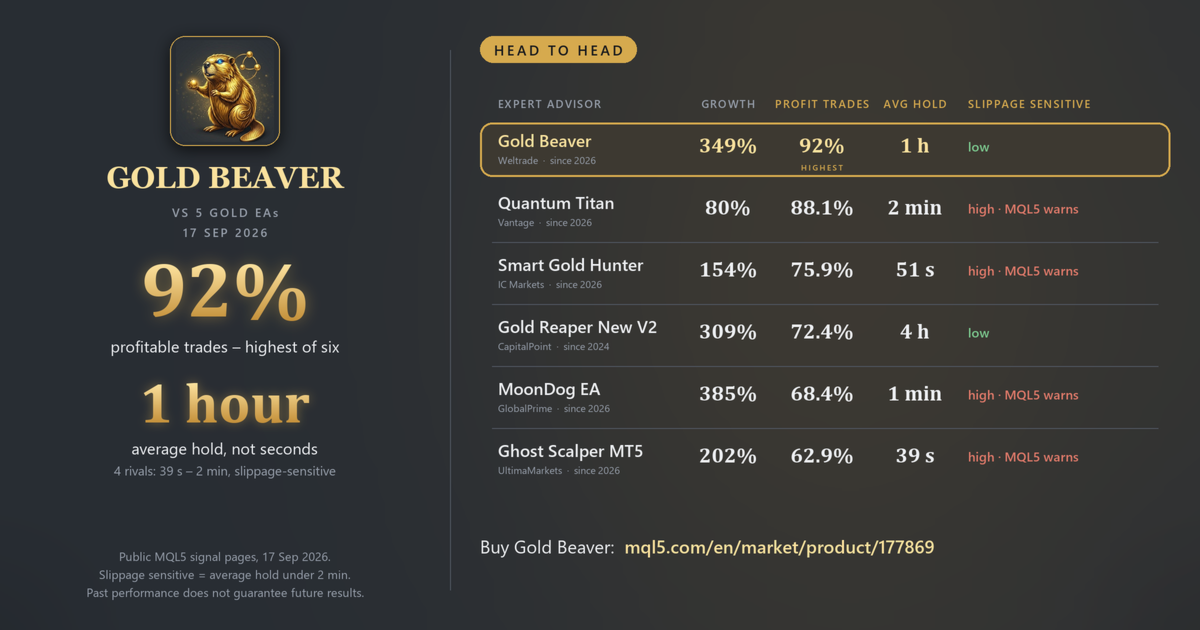
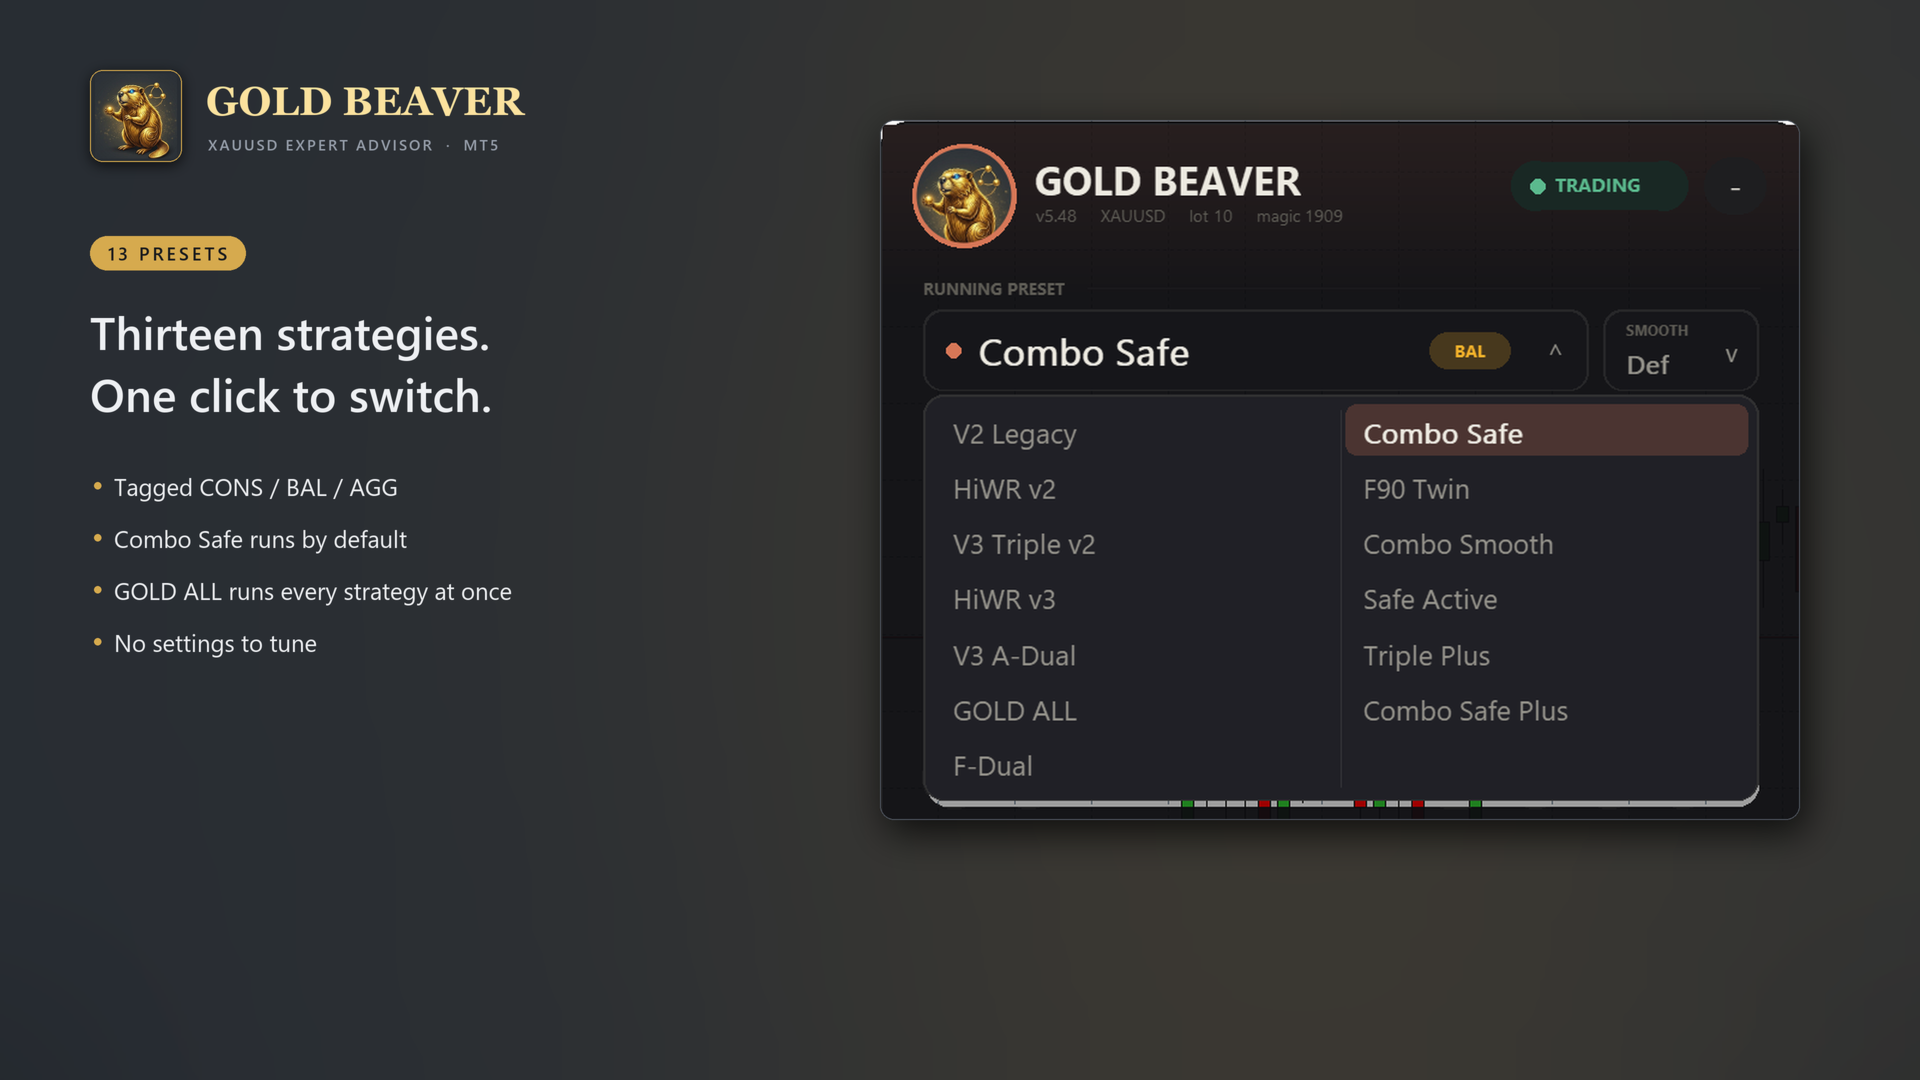
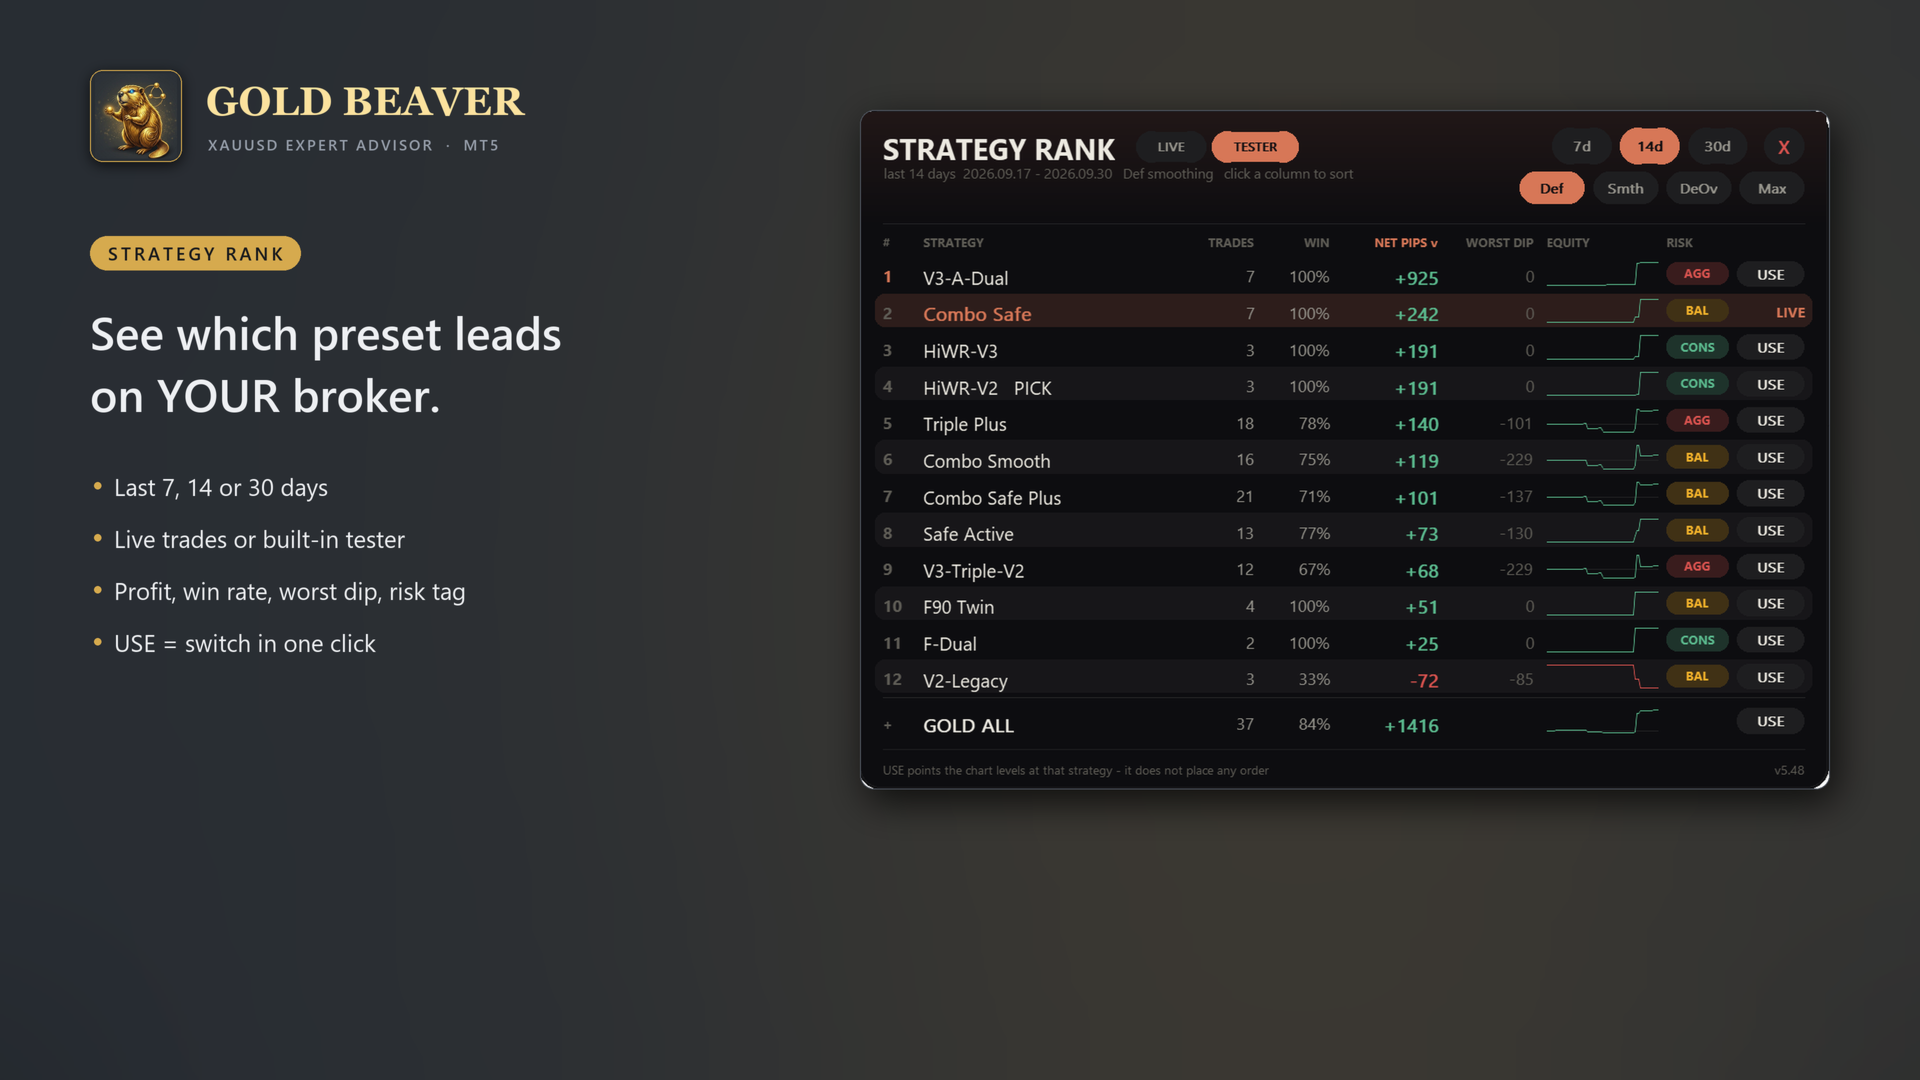
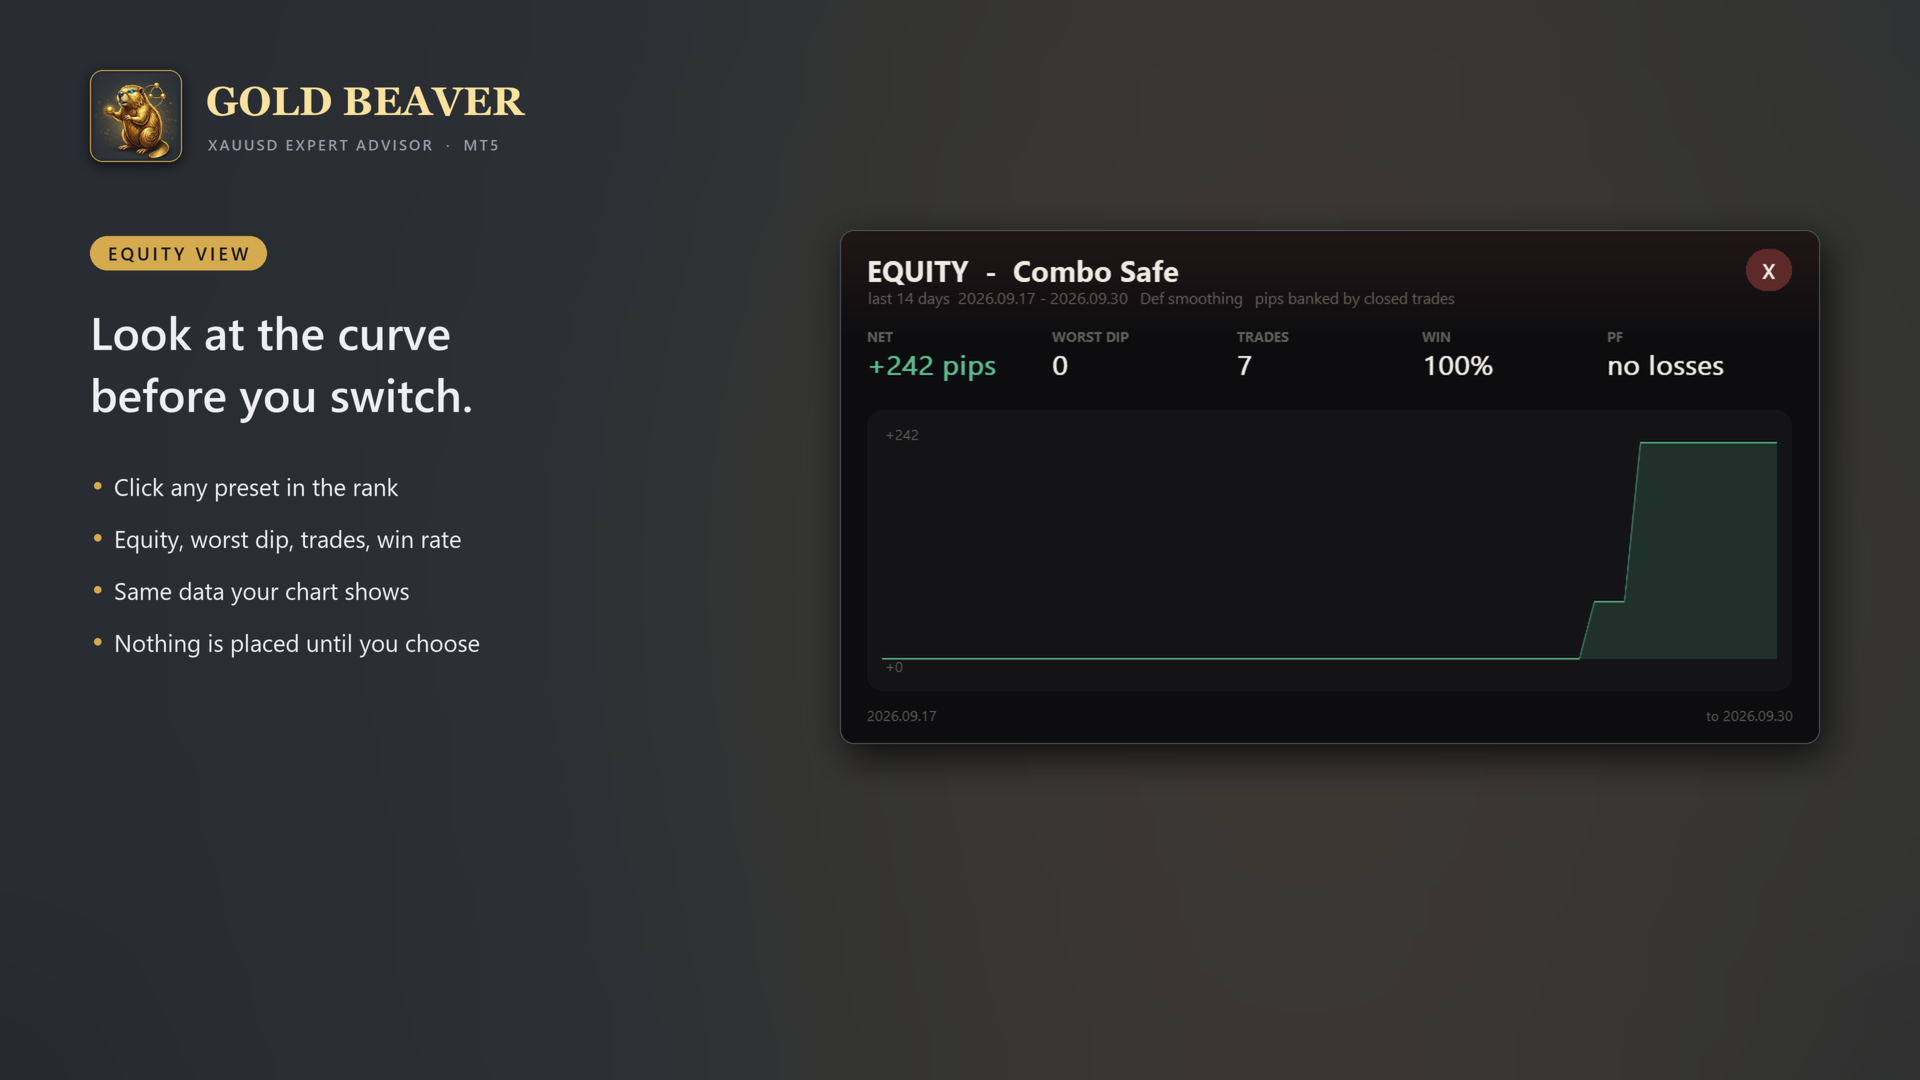
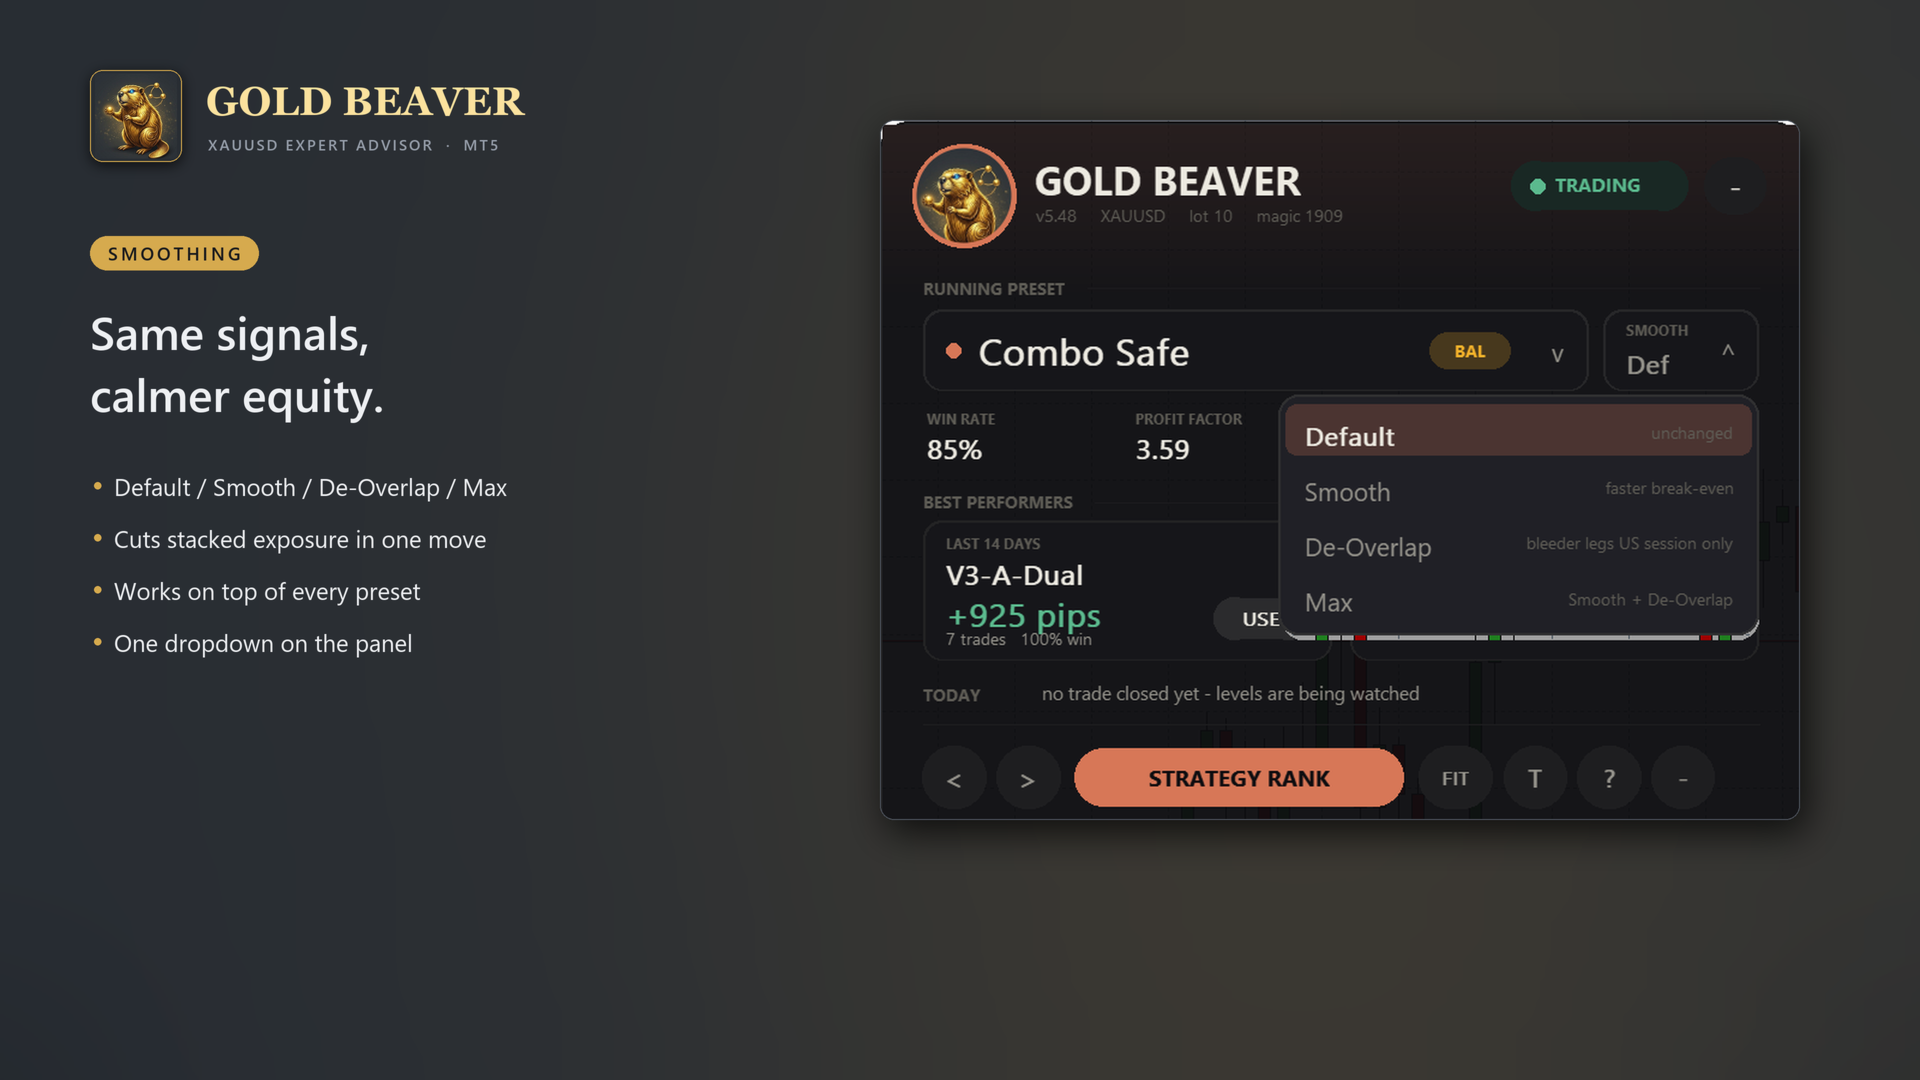
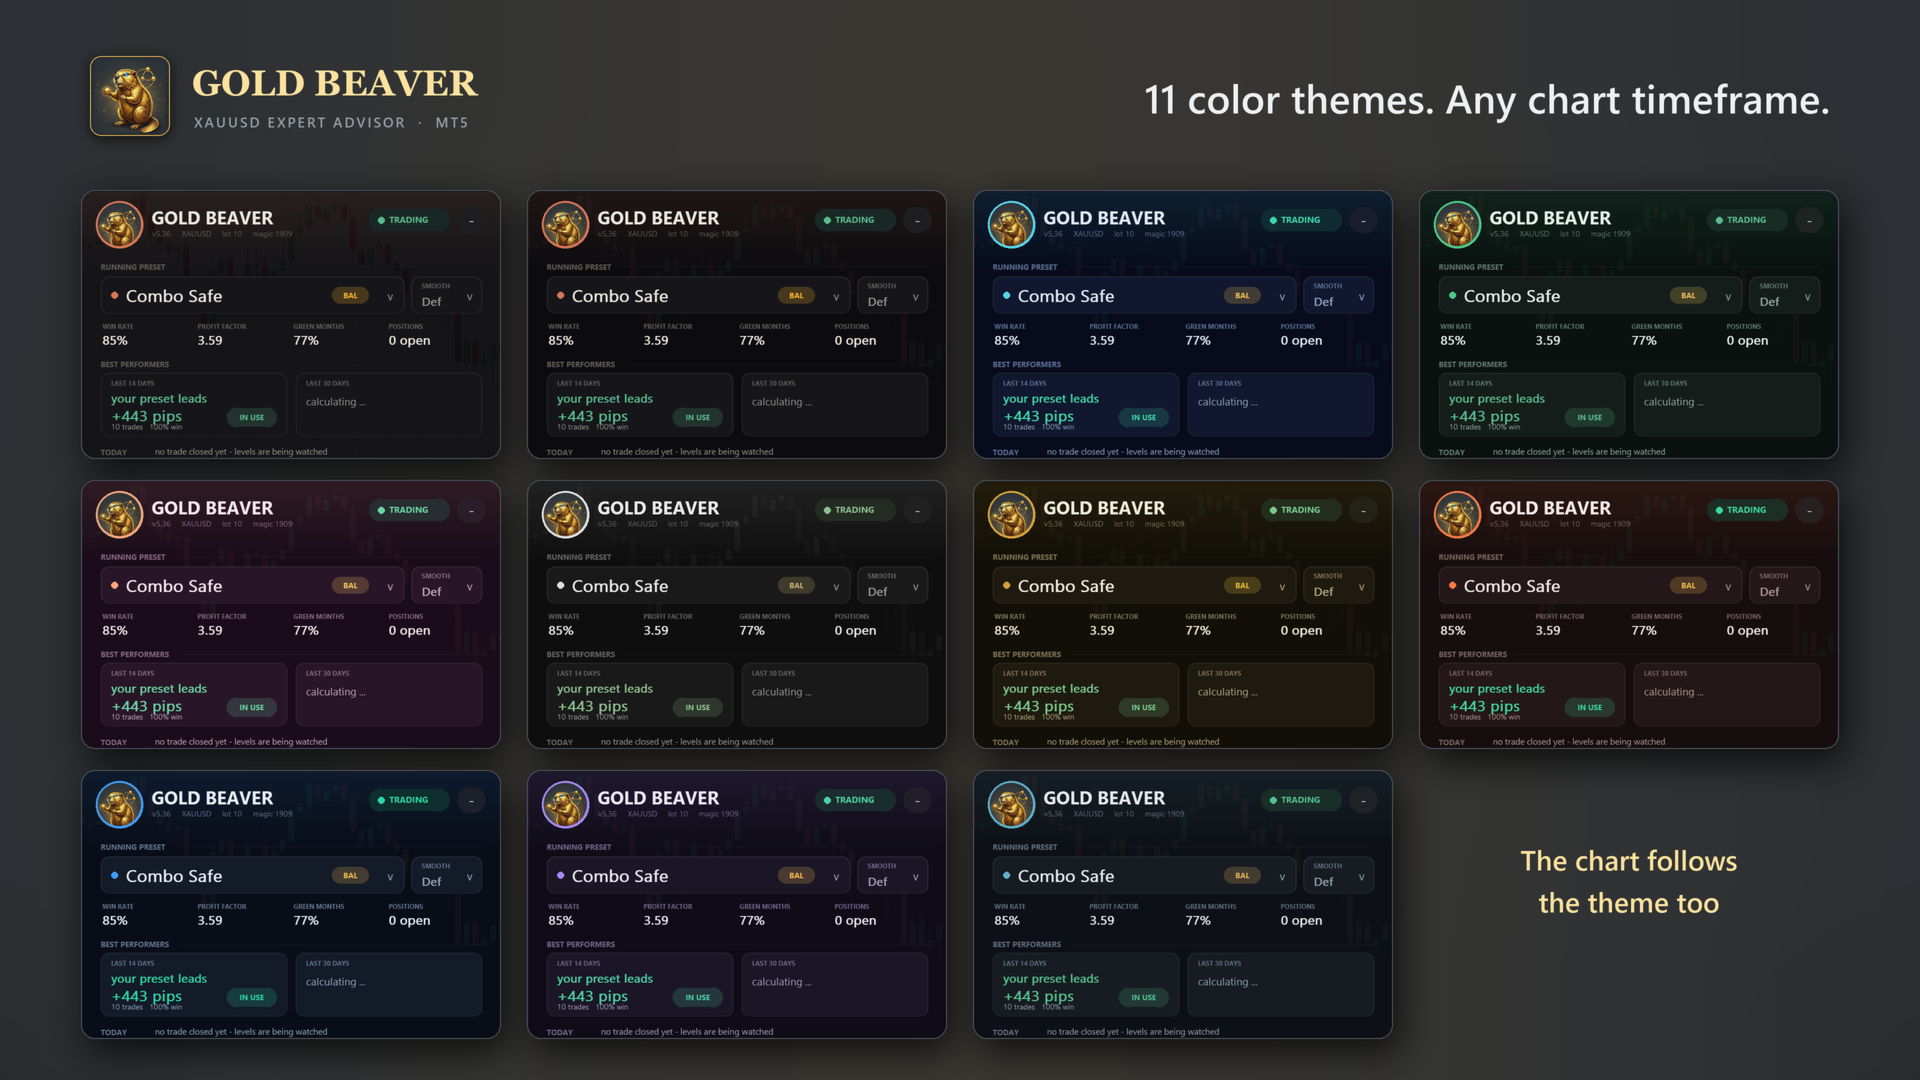
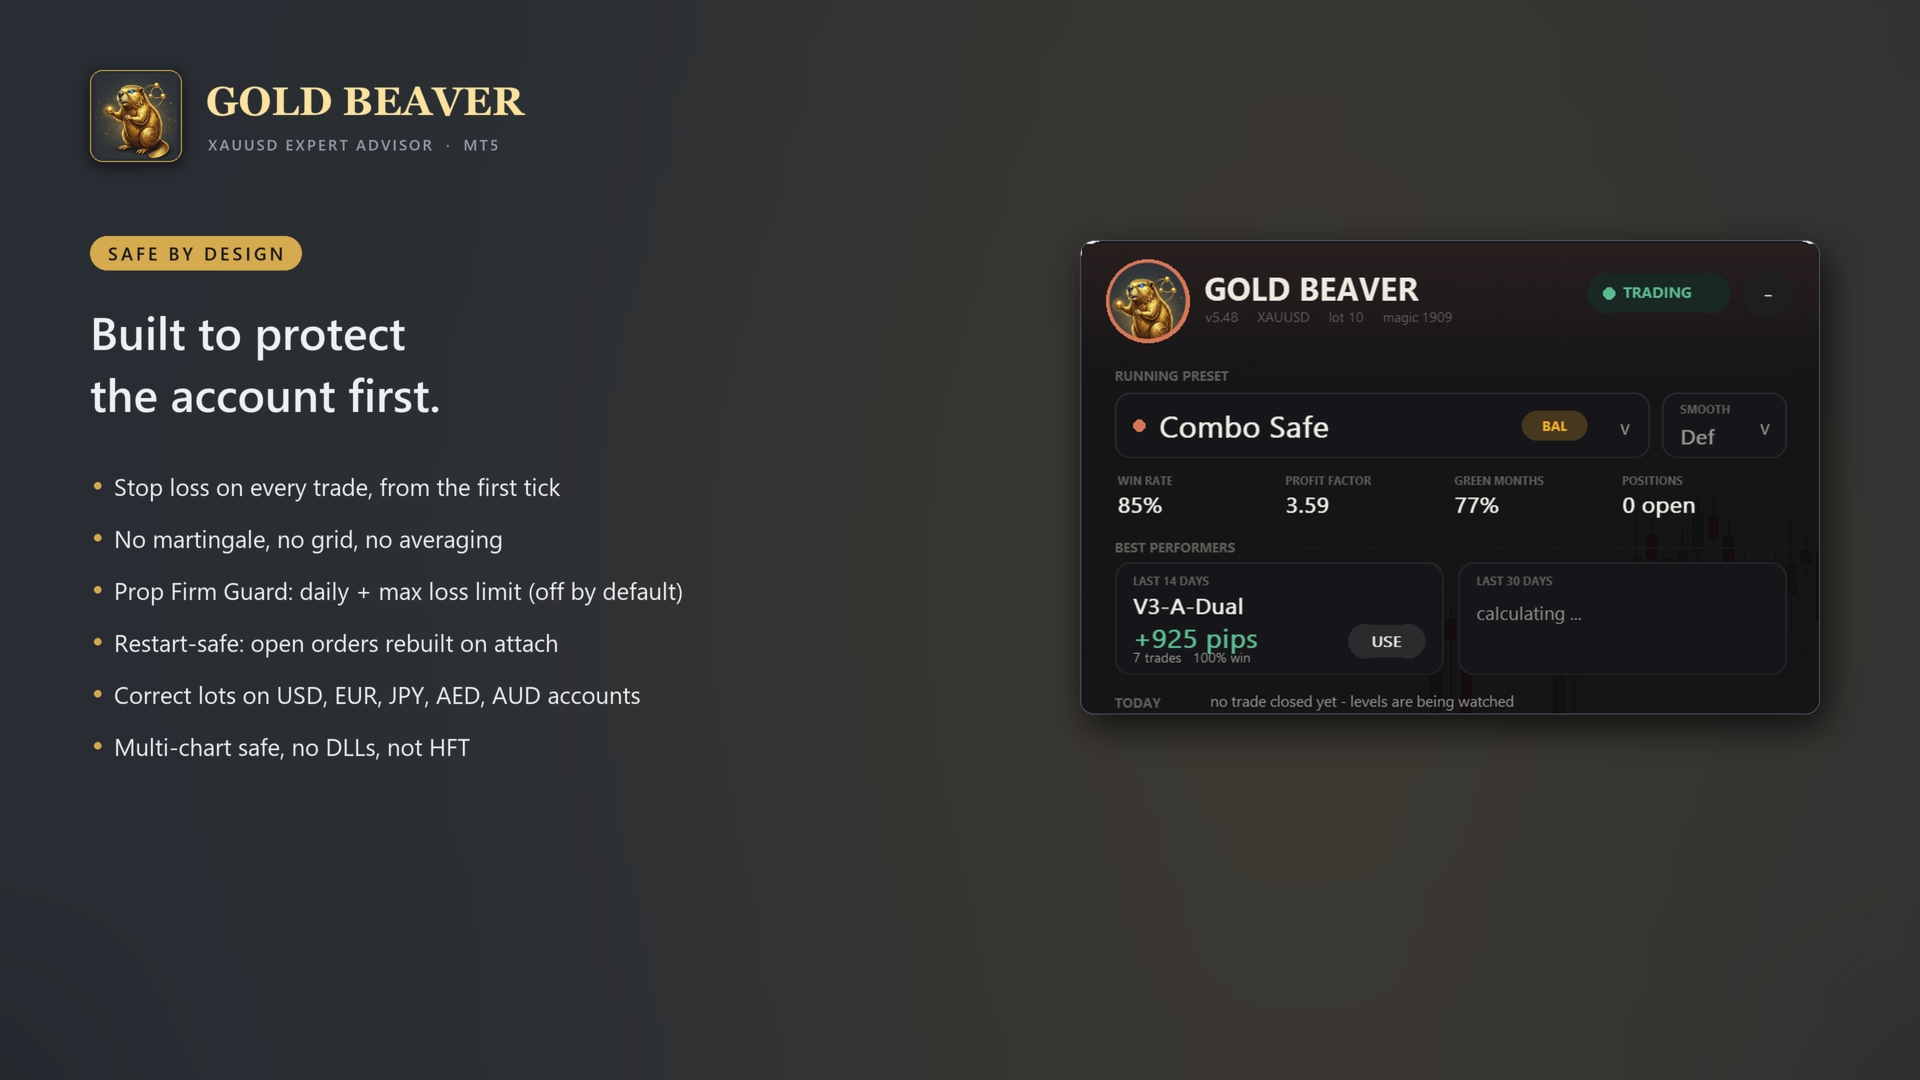
Images © the seller, served from the marketplace. See the original listing ↗
Gold Beaver live signal record
Account growth
114 closed trades from 21 May 2026 to 23 Oct 2026.
The shape of the record
Six measures on fixed scales — the same scales for every product on this site.
- Winning trades0–100% of closed trades
- Losing trades0–100% of closed trades
- Maximum drawdown0–100% below the running peak
- Profit factor1.0 at the centre, 3.0 at the rim
- Recovery factor0 at the centre, 10× at the rim
- Profitable months0–100% of months in the record
Where the balance came from
Trading profit against the money paid into and taken out of the account.
Time spent below the previous peak
Deepest fall 14.4%, over 42 days.
Result by month
83.3% of months finished up.
Download
Download and pricing
Gold Beaver free download
There is a free download, and it is the demo on the product's own MQL5 listing — not a build from somewhere else. The two columns below are what separates it from the paid version. What the demo can and cannot do.
Free demo
$0
- Runs in the MetaTrader 5 Strategy Tester
- Backtest on your own broker's price history
- Cannot trade a live or demo account
- Downloaded 2,065 times
Full version — from us
$29.99save 93%
- Trades live and demo accounts
- 5 activations per licence
$449on the MQL5 Market- Licensed by the seller — the same build
The demo link goes to the seller's own MQL5 listing, where the free demo is hosted. The paid version is sold by us under licence — it is the seller's build, not a copy or a repack, and the MQL5 listing is linked above so you can compare the two before you buy. Anything offering a paid Expert Advisor as a freelive download is pirated, unsupported, and a common way to get a trading account drained by a modified build.
What Gold Beaver's record shows
Grid / basket positions
Up to 5 positions were held on XAUUSD_I at the same time. Baskets like this share one adverse move, so the account's real exposure is the whole ladder rather than any single trade.
How this was measured
- Peak simultaneous positions
- 5
- Symbol
- XAUUSD_I
- Measured from
- overlapping open/close times
Small wins, large losses
93.9% of trades win, but the average win is only 0.32× the average loss. A win rate this high is a consequence of the payoff, not evidence of an edge.
How this was measured
- Win rate
- 93.9%
- Average win / average loss
- 0.32×
Short track record
114 trades over 5.1 months. Metrics from a record this size are indicative rather than conclusive — a strategy needs to meet a market it dislikes before its drawdown figure means much.
How this was measured
- Trades
- 114
- Months
- 5.1
How Gold Beaver trades
Read off the record rather than the sales page: how long it holds, which way it leans, and what market the figures actually describe.
How long it stays in
Positions last 1.0 h on average, which makes this an intraday system whatever the listing calls it. Holding time decides how much the spread costs you and how much overnight risk you are carrying.
Which way it trades
Its 122 trades split 41.0% long to 59.0% short, so the result does not rest on the market having gone one way.
Built around one market
Everything here is XAUUSD. A single-market record says nothing about how it behaves anywhere else, so read every figure below as being about XAUUSD alone.
Where the money came from
The same totals the listing publishes, divided into the numbers that say whether an edge is real and whether it would survive being run on a different account.
Money won against money lost
It won $639 and lost $130, a profit factor of 4.91. For every $1.00 it handed back it took $4.91 in gross profit.
Where the edge comes from
It wins 94.3% of the time, but its average win is only 0.3× its average loss. The edge is frequency, not size — it needs about 77% of trades to win simply to break even.
What one trade is worth
Averaged over 122 trades, each returned $4.17 on an account that opened at $60. That is the figure to multiply by your own trade count — not the headline growth.
Growth, per month
+416.7% total over 6 months compounds to +34.6% a month. The monthly rate is the comparable number: a total says as much about how long an account ran as about how well it traded.
What could go wrong with Gold Beaver
Every figure here is already in the record. These are the parts of it a summary table averages away.
Two drawdowns, not one
Drawdown reached 18.2% on equity and 14.3% on closed trades. The two sitting close together is what you want — it means open losses were not being parked out of sight.
The worst single trade
Its worst trade lost $24.47, 1.3× the average loss of $18.60. The account grew 4.0× over the record, which accounts for most of that spread — adjusted for it the worst loss is 0.3× the average. Adjusted, the losses cluster rather than fan out, which is the shape a stop produces.
Its longest cold spell
It lost 2 trades in a row at some point. At the average loss that is about $37, or 62.0% of the $60 the account opened with. Assume it happens again, and ask whether you would still be running it on the far side.
Profit against the worst dip
It made 8.5× its deepest drawdown in total profit. Above one means the record has more than covered its own worst stretch.
What Gold Beaver needs from your account
Cost and account size, against the drawdown this record already produced.
The account these figures came from
Every figure above comes from one account that opened with $60 at Weltrade-Real. A different size, a different broker or different settings is a different result.
What buyers say
Counted from the reviews MQL5 publishes on the listing. We count the subjects raised and the ratings given; we do not reprint the reviews.
What the marketplace scores it
4.43 out of 5 from 9 reviews on MQL5. That is a rating of the purchase — the seller, the support, the documentation — and only indirectly of the trading.
The rating, split three ways
MQL5 scores it 4.10 on description, 4.40 on reliability and usability, and 4.40 on support. Buyers rate the description lowest, which is the part the headline number averages away.
What buyers actually write about
Across the 9 most recent reviews, seller support comes up most often — 4 of them mention it. Seller support is the subject appearing most in the negative ones.
How the recent ones split
Of the 9 reviews the listing serves, 6 rate it four stars or better and 1 rate it two and a half or worse. This is the most recent page rather than every review ever left, which means it describes the version on sale now.
Who maintains it
How recently it was touched, how long it has been sold, and what the marketplace record says about the seller.
Whether anyone is still working on it
Version 5.57, last updated 28 Oct 2026 — within the last month. A system still being touched is one whose author is still answering for it.
How long it has been on sale
Listed since 31 May 2026, about 6 months. A short listing history means the record you are reading has not been through much yet.
Who is behind it
MQL5 gives Arnold Bobrinskii its badges for “Sold more than 500 products”, “More than 50 signal subscriptions”. Those count marketplace volume, not trading results.
Gold Beaver vs ArtQuant Gold vs De Moore
How Gold Beaver stands against two other measured tools on the site, on the ratios that do not depend on account size. Every figure is computed from that product's own record; the marker shows which leads on each measure.
- Profit factorEverything won divided by everything lost
- 4.91
- 2.82
- 6.49▲
- Payoff ratioAverage win divided by average loss
- 0.30
- 0.82▲
- 0.74
- Max drawdownDeepest fall from a previous high
- 14.3%
- 26.7%
- 4.6%▲
- Recovery factorNet profit per unit of worst fall
- 8.50
- 2.96
- 11.88▲
- Growth per monthTotal growth compounded to a monthly rate
- 34.63%▲
- 25.78%
- 30.63%
- Win rateNot scored — a high win rate is only good if the payoff supports it
- 94.3%
- 77.4%
- 89.8%
De Moore leads on 3 of the 5 measures that could be decided — Gold Beaver on 1. The full comparison lists what the records do not share.
Gold Beaver: common questions
The four things people search for about this product, answered from the record rather than from the sales page.
Is there a Gold Beaver free download?
Yes — a free demo. Gold Beaver is sold on the MQL5 Market, and every listing there carries a demo you can download at no cost: the full algorithm, limited to the MetaTrader 5 Strategy Tester. The full version is $29.99 from us, against $449 on the MQL5 Market. MQL5 records 2,065 downloads of it.
What the demo can and cannot do, and how to spot a pirated buildDoes Gold Beaver have a live signal?
Yes. Gold Beaver publishes a live signal on MQL5 covering 122 trades over about 6 months, verified from the broker's own trade feed. It shows 34.6% a month compounded, a deepest fall of 14.3% and a profit factor of 4.91. Every figure here is recomputed from that record, which the page links.
What a verified record proves, and what a review does notIs there a Gold Beaver backtest?
Not one from us, and deliberately: a backtest is run by whoever is selling the product, on settings they choose. Instead this page measures 122 real trades over about 6 months of forward results, which is stronger evidence than any backtest: nobody can re-run it until it looks good.
Why we publish no backtests — and how to run your own in MetaTrader 5Is there a Gold Beaver Myfxbook review?
Not that we can verify. Gold Beaver is not tracked on Myfxbook, and we will not point at a third-party page we cannot confirm belongs to this product — a name match is not proof. Its verified record is the MQL5 signal this page links.
Why a name match is not proof, and what a marketplace rating measuresIs Gold Beaver profitable?
Over 122 trades and about 6 months, the tracked account grew 416.7%, which is 34.6% a month compounded. The deepest it fell on the way was 14.3%. That is one account, on its settings and its broker, over that period.
What pairs does Gold Beaver trade?
One symbol: XAUUSD. A record on a single symbol says nothing about how it behaves on another, so treat results elsewhere as untested.
What timeframe does Gold Beaver trade?
It holds a position for 1.0 h on average across the published record. That is intraday — positions are generally opened and closed within the day.
Does Gold Beaver need a VPS?
It holds for 1.0 h on average, so latency matters less than uptime here. The terminal still has to be running when the strategy wants to act, which is the actual argument for a VPS at any hold time.
What deposit does Gold Beaver need?
We do not publish a recommended deposit, because that is the seller's claim to make and ours to check. What the record shows is the account it was tracked on, which opened at $60. The deepest drawdown on that account was 14.3%, so an account too small to sit through the same fall in money terms would have been closed out before the record recovered.
Is Gold Beaver safe to run on a live account?
Not in the sense the question usually means. The worst fall on the record was 14.3%. Our checks raised small wins, large losses — the risk panel on this page says what each one means and what triggered it. Size against that fall, not against the average month.
Does Gold Beaver work on MetaTrader 4?
No. This is the MetaTrader 5 build, and a build for one terminal does not run on the other. Any MetaTrader 4 version is a separate listing with its own record, and nothing measured here carries across to it.
Gold Beaver specification
- Platform
- MetaTrader 5
- Type
- Expert Advisor
- Author
- Arnold Bobrinskii
- Symbols
- XAUUSD
- Version
- 5.57
- Published
- 31 May 2026
- Last updated
- 28 Oct 2026
- Tracked account
- Weltrade-Real · 1:500
- Opening deposit
- $60
- Current balance
- $687
- Record length
- 24 weeks (5.5 months)
- Max drawdown by equity
- 18.2% · $18
- Max drawdown by balance
- 14.33% · $60
- Worst losing streak
- 2 trades
- Trades analysed
- 122
- Average hold
- 1.0 h
- Expected payoff
- $4 per trade
- Sharpe (as published)
- 0.29
- History measured
- 21 May 2026 – 23 Oct 2026
- Trades in the history file
- 114
- Opening balance
- $60
- Data source
- MQL5 live signal 2375536, statistics as published on the signal page
Got a question?
Ask us on Telegram
Ask about any product here, or tell us a figure looks wrong — Telegram reaches us fastest. Free, no email address required, and nothing in any of it is financial advice.