Cortex IDX
Version2.20updated
Cortex IDX is a US30 Expert Advisor for MetaTrader 5, published by Vladimir Mametov. Its linked live signal covers 121 trades in 4 months, at a profit factor of 5.08 and a win rate of 95.04%. A win and a loss are 3.8× apart, so one loss undoes that many wins.
- 121 trades on the linked live signal
- 15 weeks of recorded history
- Tracked on an account opened with 500 USD
- Around 20 copies sold a month
Cortex IDX signal at a glance
The three panels from the MQL5 signal page, with the figures as published there. The drawdown on the radar is the marketplace's equity figure; the balance figure this site measures is lower and appears further down.
growth over 15 weeks
103%
No trade history stored, so the curve is not drawn.
RoboForex-ECN1:300
Transcribed from MQL5 live signal 2376781, statistics as published on the signal page. See the signal page ↗
- Growth
- +103.2%
- Max drawdown
- 16.7%
- Profit factor
- 5.08
- Win rate
- 95.0%
- Payoff ratio
- 0.27
- Recovery factor
- 2.73
Transcribed from MQL5 live signal 2376781, statistics as published on the signal page, then recomputed. See the source ↗
Cortex IDX Kept Score
Four measured quarters out of 100. Every input is a figure printed elsewhere on this page, read against a band that is the same for every product on the site.
53
out of 100
from published statistics
- Evidence4.8 / 25
121 trades over 4 months
against 0 at the floor, 24 months at full, and 0 at the floor, 500 trades at full
- Risk control20.8 / 25
16.69% worst drawdown
against 0–100% below the running peak
- Consistency25 / 25
5.08 profit factor
against 1.0 at the centre, 3.0 at the rim
- Return on risk6.8 / 25
2.73× recovery factor
against 0 at the centre, 10× at the rim
- Small wins, large losses−4
How the Kept Score is worked out, and every product scored →
Cortex IDX screenshots
4 images from the seller's listing, shown as published. Nothing on them has been measured by this site — the figures elsewhere on this page are the check.
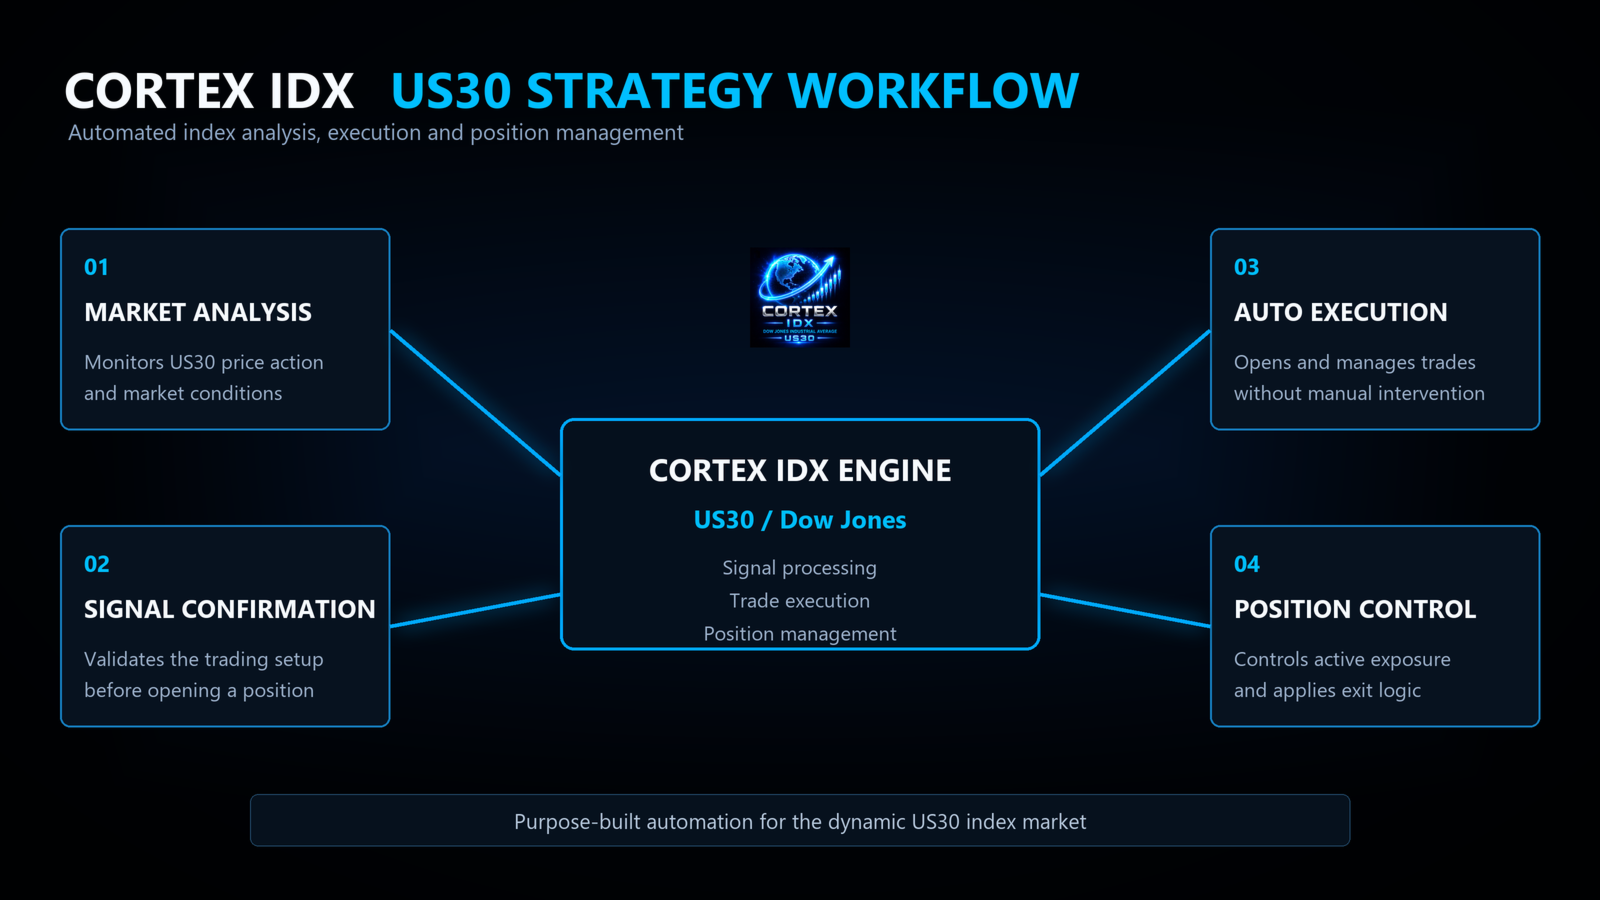
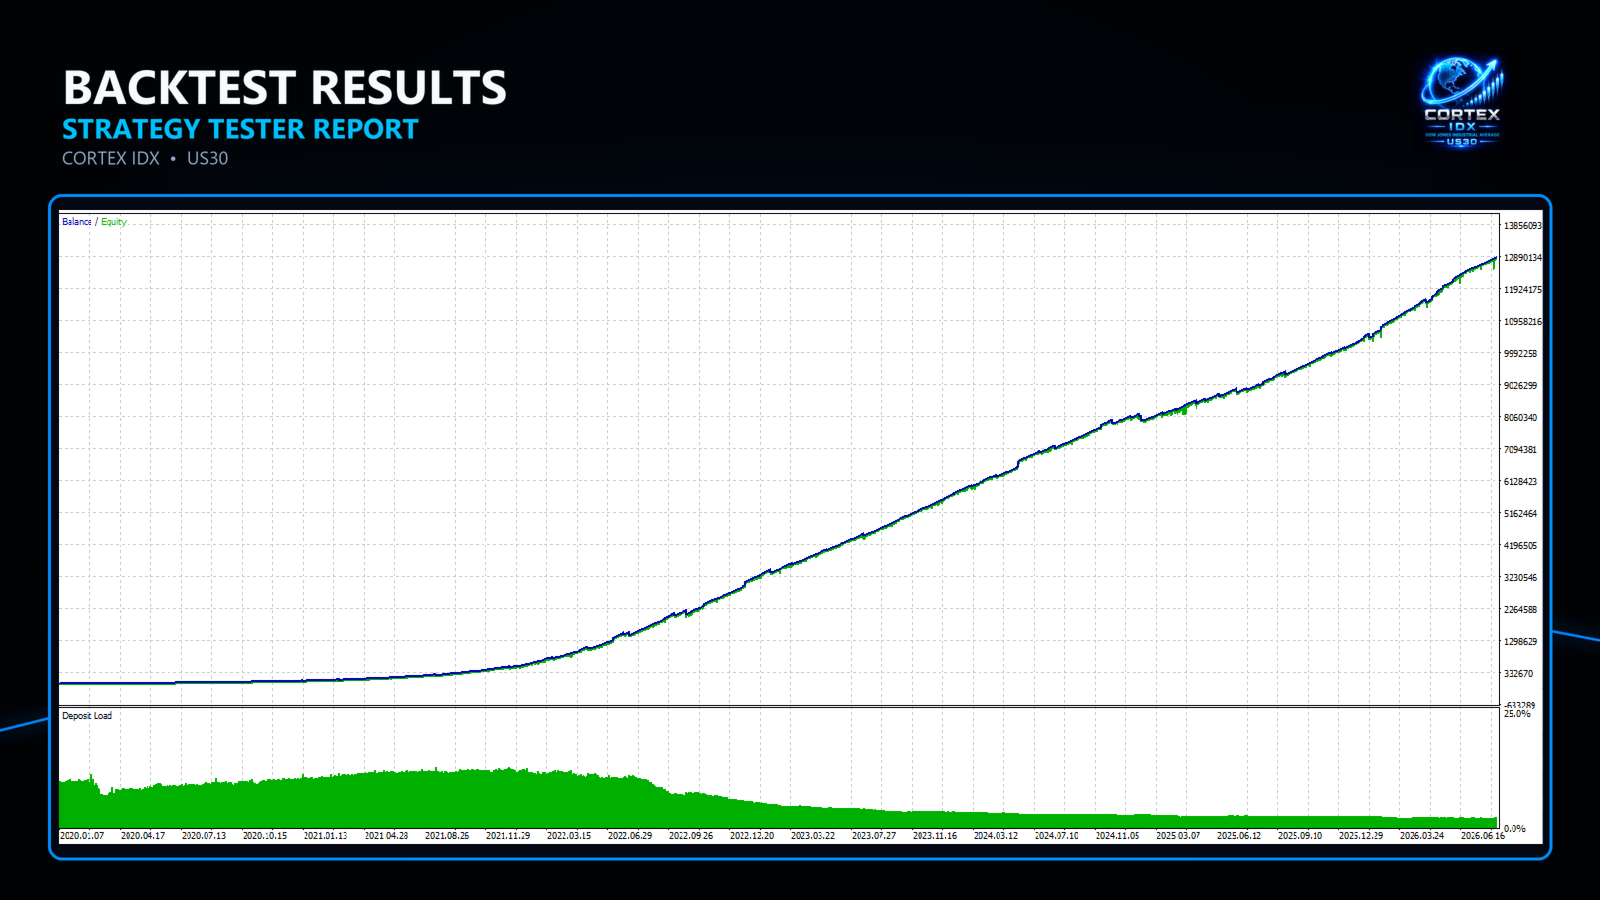
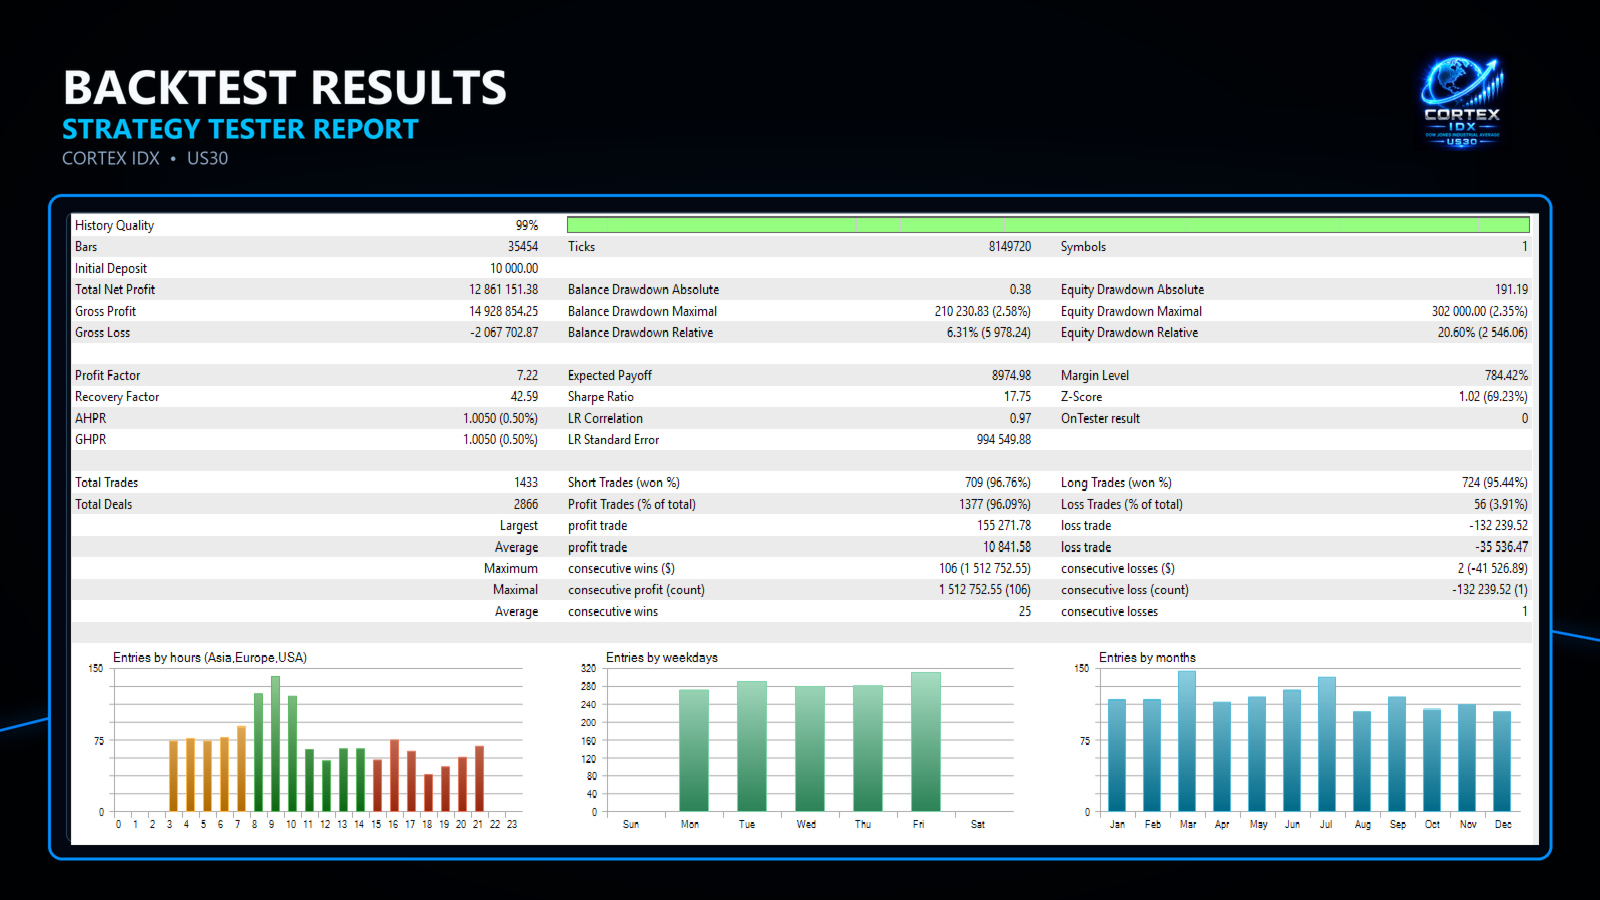
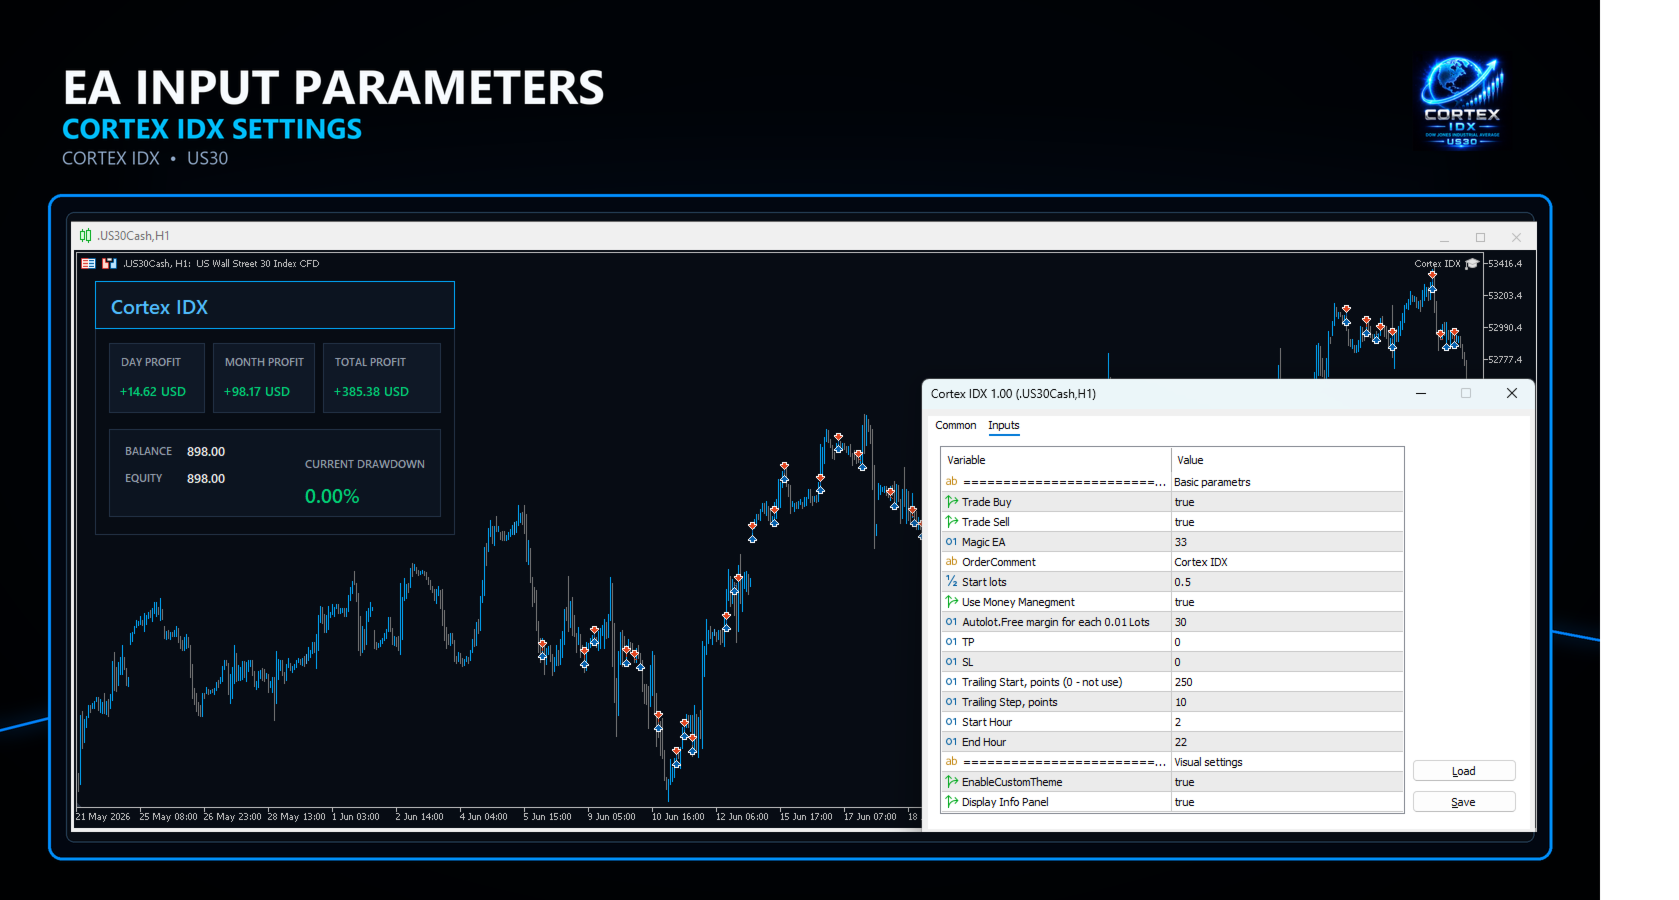
Images © the seller, served from the marketplace. See the original listing ↗
Cortex IDX results, as published
This listing publishes totals rather than a trade history, so there is no curve to draw. Every figure below is recomputed from those totals.
The number the sales page leaves out
95.0% of trades win — but one loss undoes 3.8× wins.
Both figures come from the same published table. The win rate is advertised; the ratio between the average win and the average loss is not, and it is what decides whether the win rate has to hold.
What a win is worth against what a loss costs
Drawn to the same scale. The strategy needs to keep winning about 79.1% of the time simply to break even.
Best and worst single trades
The worst loss is 2.0× the average one, so losses stay close together.
Everything won against everything lost
A profit factor of 5.08 — what the account won for each unit it lost.
Trade outcomes
34 wins in a row at best, 3 losses at worst.
Direction taken
Which way the strategy took its positions.
No equity curve. This seller publishes account totals but not a trade-by-trade history, and building a curve out of totals would mean inventing the path between them. When a trade history is available for a product, its curve and drawdown chart appear here instead.
Download
Download and pricing
Cortex IDX free download
There is a free download, and it is the demo MQL5 hosts on the listing itself. It is the full algorithm, restricted to the MetaTrader 5 Strategy Tester — you can backtest it on your own broker's history for nothing. What it cannot do is trade a live or demo account. That needs the paid version.
Free demo
$0
- Runs in the MetaTrader 5 Strategy Tester
- Backtest on your own broker's price history
- Cannot trade a live or demo account
- Downloaded 560 times
Full version
$399
- Trades live and demo accounts
- 20 activations per licence
- Bought from the seller, not from us
- We take no payment and hold no stock
Both links go to the seller's own listing. We do not host, sell or distribute this software, and we do not have a copy of it. Anything offering a paid Expert Advisor as a free live download is pirated, unsupported, and a common way to get a trading account drained by a modified build.
What Cortex IDX's record shows
Small wins, large losses
95% of trades win, but the average loss is 3.8× the average win. One losing trade erases roughly 3.8 winning ones, so the win rate describes how often it is right rather than how much it makes when it is.
How this was measured
- Win rate
- 95%
- Average win
- 5.29 USD
- Average loss
- 19.97 USD
- Wins undone by one loss
- 3.8
Tracked on a very small account
The record starts from 500 USD, so its 103.2% growth amounts to 488.49 USD in total. Percentages compound quickly at this size and the position sizes behind them are not the ones a funded account would trade.
How this was measured
- Opening deposit
- 500 USD
- Net profit
- 488.49 USD
- Best single trade
- 54.48 USD
Short track record
121 trades over 3.5 months. A record this size is indicative rather than conclusive — a strategy needs to meet a market it dislikes before its drawdown figure means much.
How this was measured
- Trades
- 121
- Months
- 3.5
- Weeks
- 15
Not checked: martingale position sizing, grid and basket exposure, stop-loss placement, gaps in the record. These need a trade-by-trade history, which this seller does not publish — so treat them as unknown rather than clean.
How Cortex IDX trades
Read off the record rather than the sales page: how long it holds, which way it leans, and what market the figures actually describe.
How long it stays in
Positions last 5.0 h on average, which makes this an intraday system whatever the listing calls it. Holding time decides how much the spread costs you and how much overnight risk you are carrying.
Which way it trades
Its 121 trades split 57.9% long to 42.1% short, so the result does not rest on the market having gone one way.
Built around one market
Everything here is US30. A single-market record says nothing about how it behaves anywhere else, so read every figure below as being about US30 alone.
Where the money came from
The same totals the listing publishes, divided into the numbers that say whether an edge is real and whether it would survive being run on a different account.
Money won against money lost
It won $608 and lost $120, a profit factor of 5.08. For every $1.00 it handed back it took $5.08 in gross profit.
Where the edge comes from
It wins 95.0% of the time, but its average win is only 0.3× its average loss. The edge is frequency, not size — it needs about 79% of trades to win simply to break even.
What one trade is worth
Averaged over 121 trades, each returned $4.04 on an account that opened at $500. That is the figure to multiply by your own trade count — not the headline growth.
Growth, per month
+103.2% total over 4 months compounds to +22.8% a month. The monthly rate is the comparable number: a total says as much about how long an account ran as about how well it traded.
What could go wrong with Cortex IDX
Every figure here is already in the record. These are the parts of it a summary table averages away.
Two drawdowns, not one
Drawdown reached 16.7% on equity and 6.1% on closed trades. The two sitting close together is what you want — it means open losses were not being parked out of sight.
The worst single trade
Its worst trade lost $39.84, 2.0× the average loss of $19.97. The account did not grow enough over the record to explain that spread, so the spread is in the losses themselves. Adjusted, the losses cluster rather than fan out, which is the shape a stop produces.
Its longest cold spell
It lost 3 trades in a row at some point. At the average loss that is about $60, or 12.0% of the $500 the account opened with. Assume it happens again, and ask whether you would still be running it on the far side.
Profit against the worst dip
It made 2.7× its deepest drawdown in total profit. Above one means the record has more than covered its own worst stretch.
What Cortex IDX needs from your account
Cost and account size, against the drawdown this record already produced.
The account these figures came from
Every figure above comes from one account that opened with $500 at RoboForex-ECN. A different size, a different broker or different settings is a different result.
What buyers say
Counted from the reviews MQL5 publishes on the listing. We count the subjects raised and the ratings given; we do not reprint the reviews.
What the marketplace scores it
4.00 out of 5 from 8 reviews on MQL5. That is a rating of the purchase — the seller, the support, the documentation — and only indirectly of the trading.
The rating, split three ways
MQL5 scores it 4.00 on description, 4.00 on reliability and usability, and 4.00 on support. Buyers rate reliability and usability lowest, which is the part the headline number averages away.
What buyers actually write about
Across the 8 most recent reviews, results and profit comes up most often — 2 of them mention it. None of the recurring subjects appears mainly in negative reviews.
How the recent ones split
Of the 8 reviews the listing serves, 6 rate it four stars or better and 2 rate it two and a half or worse. This is the most recent page rather than every review ever left, which means it describes the version on sale now.
Who maintains it
How recently it was touched, how long it has been sold, and what the marketplace record says about the seller.
Whether anyone is still working on it
Version 2.20, last updated 4 Sept 2026 — within the last month. A system still being touched is one whose author is still answering for it.
How long it has been on sale
Listed since 7 Aug 2026, about 1 months. A short listing history means the record you are reading has not been through much yet.
Who is behind it
MQL5 gives Vladimir Mametov its badges for “Sold more than 1,000 products”, “Completed more than 1,000 orders”. Those count marketplace volume, not trading results — a seller can move a great many copies of something that loses money.
Cortex IDX vs GoldenShot vs Neo Delta
How Cortex IDX stands against two other measured tools on the site, on the ratios that do not depend on account size. Every figure is computed from that product's own record; the marker shows which leads on each measure.
- Profit factorEverything won divided by everything lost
- 5.08
- 322.50▲
- 2.20
- Payoff ratioAverage win divided by average loss
- 0.27
- 21.50▲
- 0.44
- Max drawdownDeepest fall from a previous high
- 16.7%
- 0.0%▲
- 6.7%
- Recovery factorNet profit per unit of worst fall
- 2.73
- 321.50▲
- 1.20
- Growth per monthTotal growth compounded to a monthly rate
- 22.80%
- 60.58%▲
- 19.95%
- Win rateNot scored — a high win rate is only good if the payoff supports it
- 95.0%
- 93.8%
- 83.3%
GoldenShot leads on 5 of the 5 measures that could be decided — Cortex IDX on 0. The full comparison lists what the records do not share.
Cortex IDX: common questions
The four things people search for about this product, answered from the record rather than from the sales page.
Is there a Cortex IDX free download?
Yes — a free demo. Cortex IDX is sold on the MQL5 Market, and every listing there carries a demo you can download at no cost. It is the full algorithm limited to the MetaTrader 5 Strategy Tester, so you can backtest it on your own broker history for nothing, but it will not trade a live or demo account. The full version is $0 from us, against $399 on the MQL5 Market. MQL5 records 560 downloads of it. Anything advertising the paid version as a free live download is a pirated build — usually modified, always unsupported, and a common way to lose an account.
Does Cortex IDX have a live signal?
Yes. Cortex IDX publishes a live signal on MQL5 covering 121 trades over about 4 months, and MQL5 verifies it from the broker's own trade feed rather than from the seller. It shows 22.8% a month compounded, a deepest fall of 16.7% and a profit factor of 5.08. Every figure on this page is recomputed from that record, and the page links it so you can check the arithmetic yourself.
Is there a Cortex IDX backtest?
Not one from us, and deliberately. A backtest is run by whoever is selling the product, on history and settings they choose, and it can be tuned until it looks good — which is why a flawless backtest and a poor live record so often sit on the same page. Instead this page measures 121 real trades over about 4 months of forward results, which is stronger evidence than any backtest: nobody can re-run it until it looks good. If you want a backtest, run your own: the free MetaTrader 5 demo does exactly that on your own broker's spreads, which is the only backtest whose assumptions you control.
Is there a Cortex IDX Myfxbook review?
Not that we can verify. Cortex IDX is not tracked on Myfxbook, and we will not point at a third-party page we cannot confirm belongs to this product — a name match is not proof. Its verified record is the MQL5 signal linked on this page, which serves the same purpose: an independent platform reading the broker's trade feed directly rather than taking the seller's word for it. Reviews on the MQL5 listing itself rate the purchase — the seller, the support, the documentation — rather than the trading, which is what the measured figures on this page are for.
Cortex IDX specification
- Platform
- MetaTrader 5
- Type
- Expert Advisor
- Author
- Vladimir Mametov
- Symbols
- US30
- Version
- 2.20
- Published
- 7 Aug 2026
- Last updated
- 4 Sept 2026
- Tracked account
- RoboForex-ECN · 1:300
- Opening deposit
- $500
- Current balance
- $468
- Record length
- 15 weeks (3.5 months)
- Max drawdown by equity
- 16.69% · $179
- Max drawdown by balance
- 6.11% · $58
- Worst losing streak
- 3 trades
- Trades analysed
- 121
- Average hold
- 5.0 h
- Expected payoff
- $4 per trade
- Sharpe (as published)
- 0.48
- Data source
- MQL5 live signal 2376781, statistics as published on the signal page